Understanding your scan analytics
Totals, trends, locations, and device breakdowns explained.
Every scan of a Qbit code reports back, so you always know what's working. Scan analytics are included with Premium and Team plans.
Where to find it
- Per code: open any code from QR Codes - the Analytics section is on its detail page.
- Across all codes: your Dashboard shows total scan performance, a 30-day trend, and your top five codes by scans.
Reading the numbers
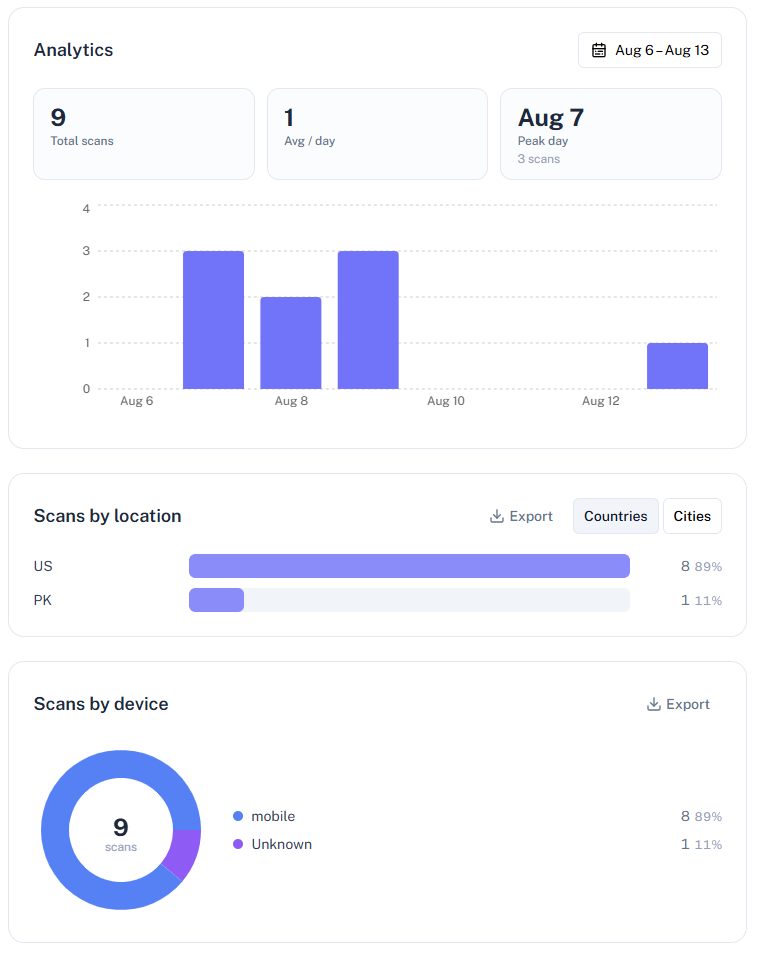
Each code's analytics cover a date range you choose (the last 7 days by default, up to 90 days back):
- Total scans, Avg / day, and Peak day - the headline numbers, with a daily bar chart underneath.
- Scans by location - a ranked list of countries, with a toggle to see cities. Great for multi-location campaigns.
- Scans by device - a breakdown of what people scanned with.
Every breakdown has an Export button that downloads the full list as a CSV for deeper analysis in a spreadsheet.
What counts as a scan - and what doesn't
- A scan is recorded every time someone follows your code's short link, with a timestamp, approximate location, device type, and referrer.
- The Test link on the code's detail page deliberately does not count - use it to check destinations without polluting your data.
- Privacy is built in: scanner IP addresses are hashed and never stored raw.
Getting more from analytics
- Give codes specific names ("Window poster - Main St", not "Code 3") so the top-performers list means something.
- Use one code per placement, so you can compare a poster against a flyer against a table tent.
- Add UTM parameters when the destination has its own analytics - the two views together tell the full story.
Numbers looking off? See Why aren't my scans showing up?
Still stuck? Email support@qbit.codes.